Most supply chain and finance leaders live and die by a single metric: Inventory Turnover.
It is the gold standard for measuring operational efficiency. But there is a massive catch—Inventory Turnover is a metric designed for your healthy, primary stock.
What happens when a product misses its forecast, undergoes a packaging change, or hits 40% shelf life? It falls out of your primary sales channels, and suddenly, standard metrics stop being useful. You are no longer managing flow; you are managing depreciation.
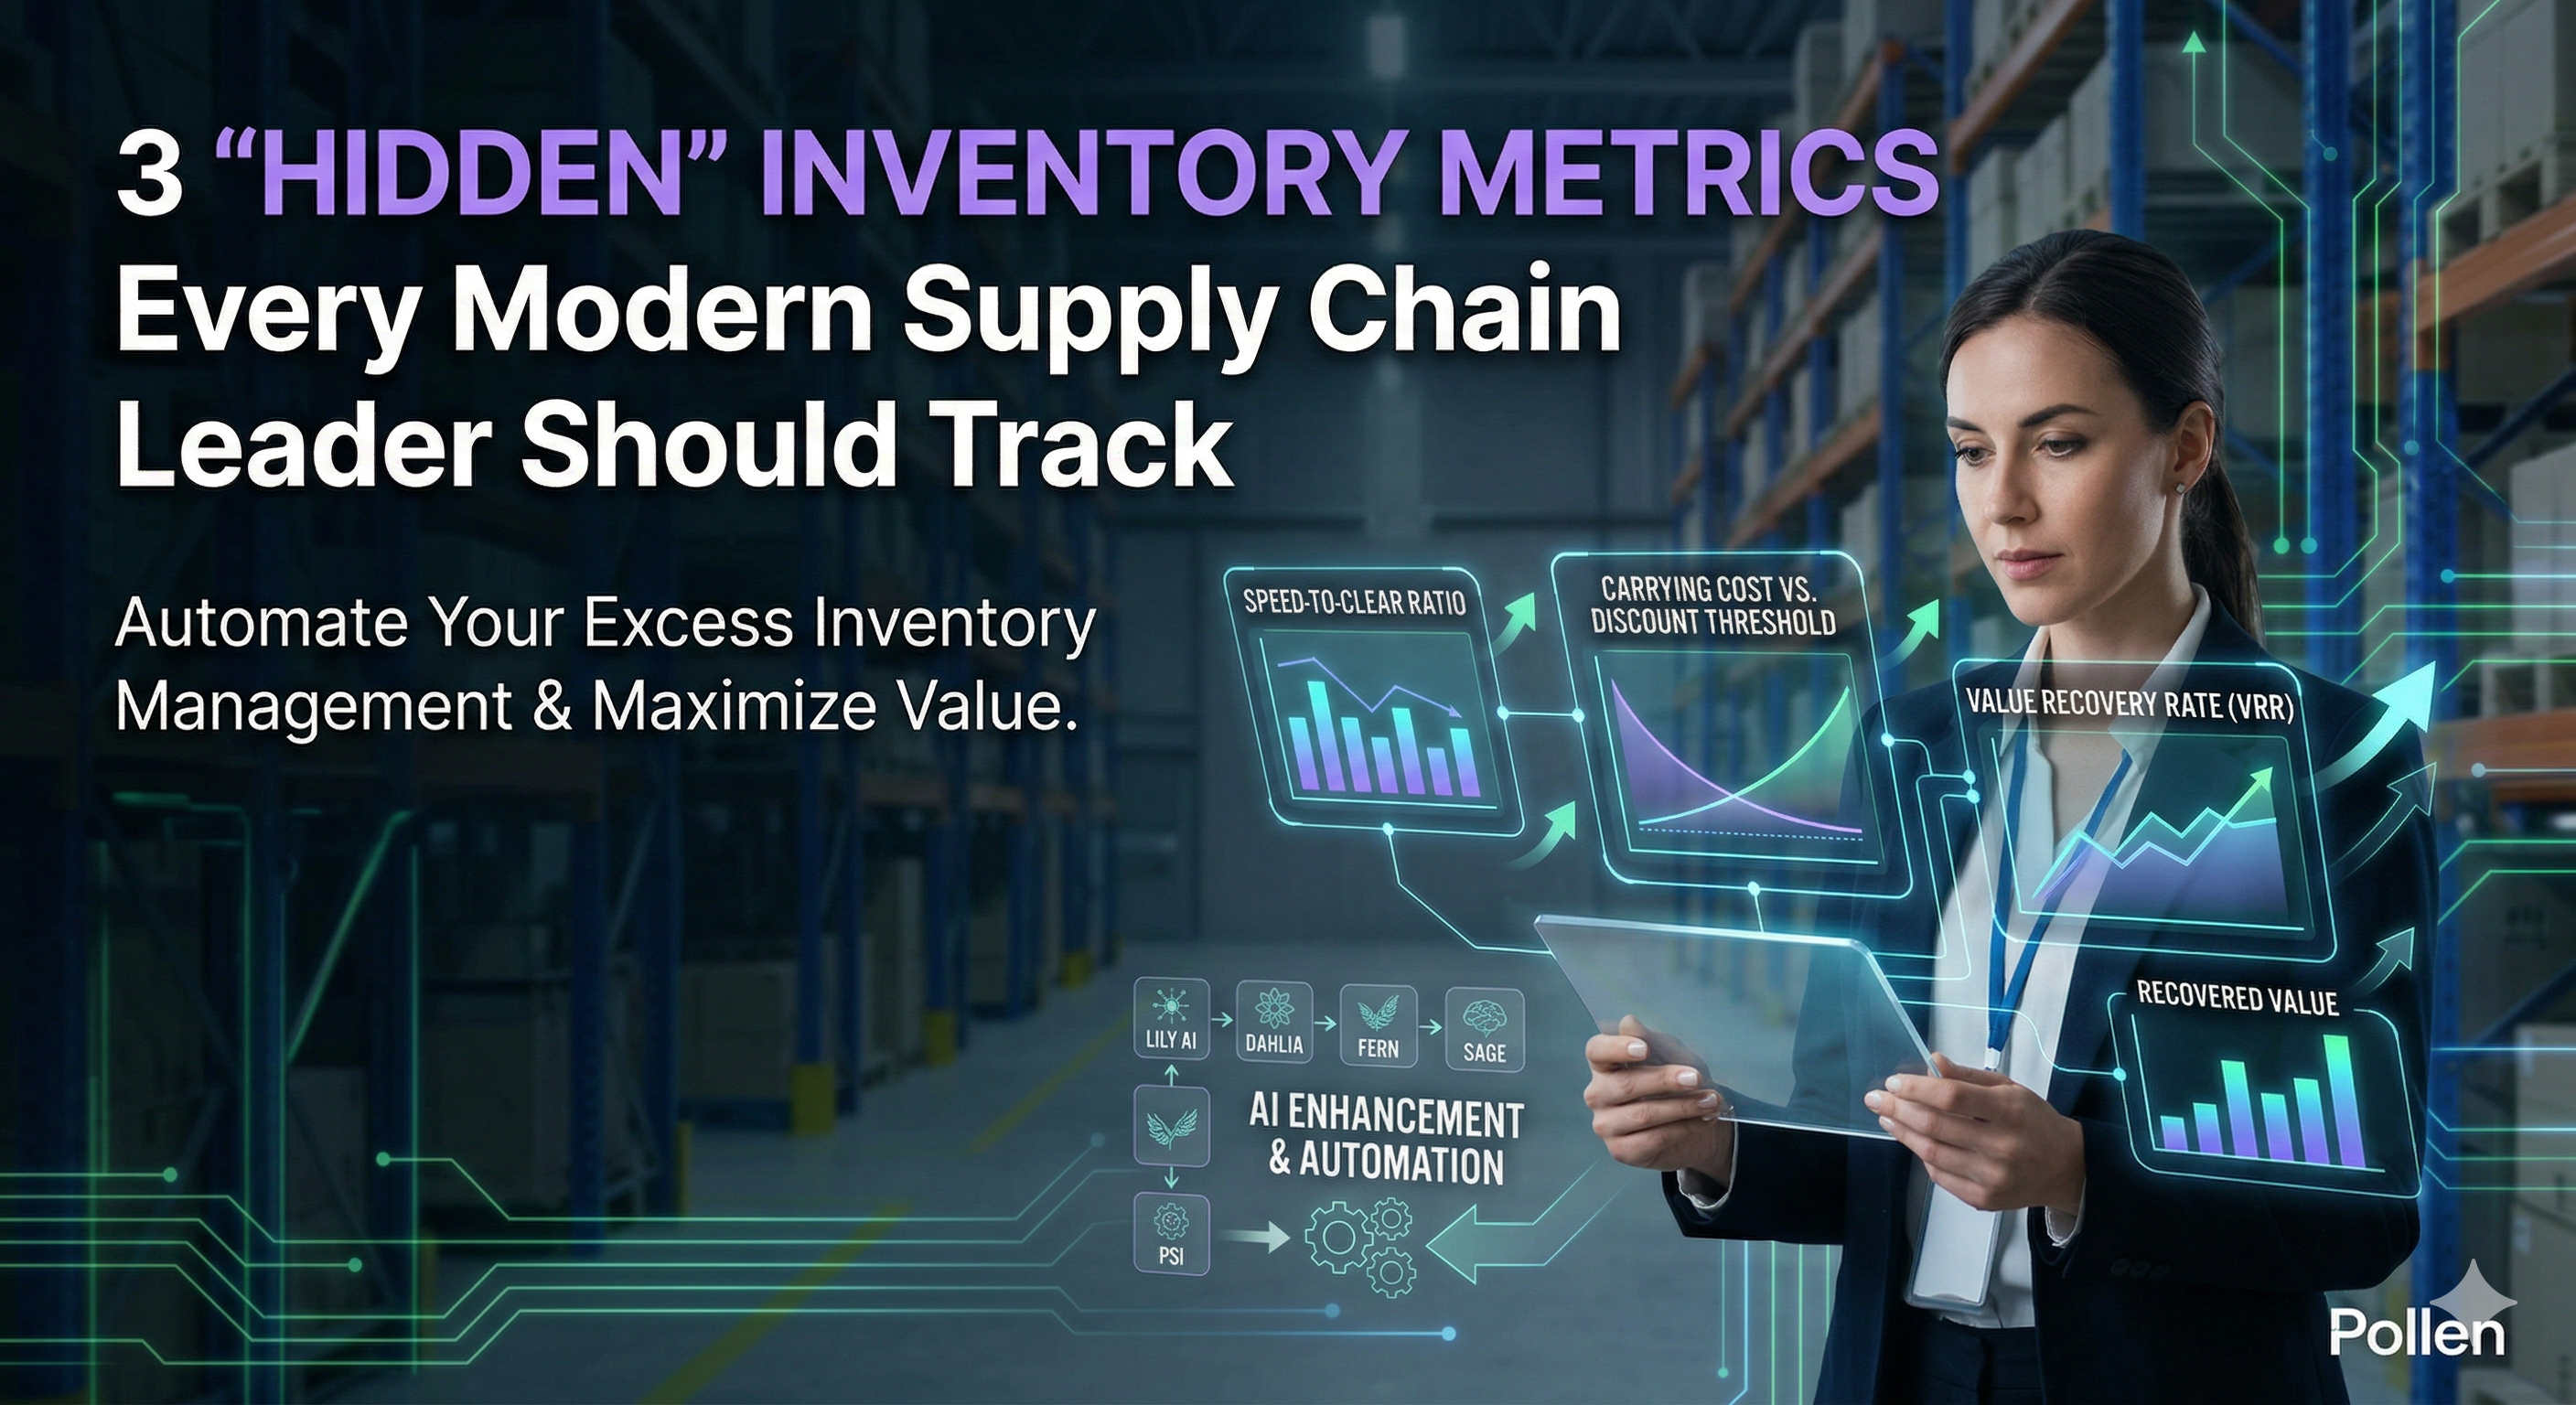
To run a truly optimized supply chain, leaders need to shift their analytical lens when dealing with surplus stock. Here are three "hidden" metrics you should be tracking to stop the financial bleed of excess inventory.
1. Speed-to-Clear Ratio (SCR)
What it is: The time it takes from the moment a SKU is flagged as "excess" or "at-risk" to the moment the stock is sold and off your books.
Why it matters: In the secondary market, time is your most expensive liability. Every day a product sits idle, its shelf life decreases, making it harder to sell. Many brands take 60 to 90 days to manually organize a liquidation sale via spreadsheets and email chains. By the time a buyer is found, the stock’s market value has plummeted, or worse, it has expired and must be destroyed.
Tracking your Speed-to-Clear Ratio exposes the operational bottlenecks in your liquidation process. If your SCR is longer than 14 days, your process is too slow for the modern market.
2. Carrying Cost vs. Discount Threshold
What it is: The mathematical tipping point where offering a deeper discount today is actually more profitable than holding out for a better price tomorrow.
Why it matters: Finance teams understandably want to protect margins. When a buyer asks for a 60% discount on liquidation stock, the instinct is often to say, "No, let's wait for someone who will take 40%."
However, this ignores Carrying Costs—the warehousing, insurance, and tied-up capital that cost businesses an average of 20-30% of their inventory's value annually. The Discount Threshold proves the math: holding a pallet for an extra four months to secure a slightly better price often results in a net negative return once carrying costs are factored in.
Understanding this threshold removes the emotion from pricing and replaces it with pure financial logic.
3. Value Recovery Rate (VRR)
What it is: The actual cash recovered from a liquidation sale divided by the original wholesale value of the excess stock.
Why it matters: When stock becomes obsolete, many companies simply view it as a write-off or a total loss. Tracking VRR shifts the psychological and financial mindset of your team. Instead of asking, "How much are we losing?" you start asking, "How efficiently are we recovering capital?"
If your historical VRR on short-expiry skincare is 15%, but you can push it to 25% through smarter buyer matching and faster execution, you have just injected pure profit back into your bottom line. VRR turns your liquidation process from a cost center into a strategic recovery engine.
The AI Solution: Automating the Math
Tracking these metrics manually on a spreadsheet is nearly impossible because the variables—shelf life, market demand, and holding costs—change every single day.
This is where Pollen’s specialized suite of AI agents and data engines takes over, replacing manual guesswork with automated, data-driven action.
PSI (The Intelligence Engine): The Pollen Slob Index acts as the "brain" behind your operations. As the world’s first market benchmark built for bulk excess inventory, it uses millions of data points to provide the core market intelligence needed to calculate your ideal Value Recovery Rate (VRR).
Dahlia (AI Demand Analyst): To optimize your Speed-to-Clear Ratio, Dahlia predicts exactly how your products will perform on the secondary market. Drawing on thousands of past trades, Dahlia forecasts sell-through rates and depletion timelines so you know exactly how long it will take to sell an item before you even list it.
Fern (AI Financial Advisor): Fern automates the math behind your Discount Threshold. By analyzing the market, Fern visually shows finance managers the exact trade-off between the discount level and the estimated time-to-clear, helping you capture up to 30% more recovery by finding the perfect pricing "sweet spot."
Sage (AI Sales Expert): To maximize your returns without risking brand cannibalization, Sage instantly matches your specific SKUs to the most relevant buyers in our network of 1,500+ bulk buyers and exporters. Sage determines the best sales strategy, routing stock to public or private catalogs for maximum brand protection.
Lily AI (Liquidation Orchestrator): Acting as the ultimate project manager, Lily ties it all together. Lily coordinates Dahlia, Fern, and Sage—enriching product details and creating buyer-ready listings to turn weeks of manual clearance preparation into minutes.
The Bottom Line
You cannot improve what you do not measure. If you are only tracking Inventory Turnover, you are turning a blind eye to the financial leaks happening at the end of your supply chain.
By utilizing Lily to orchestrate the process, Dahlia to predict timelines, Fern to optimize pricing, Sage to match buyers, and PSI to power the intelligence behind it all, you can transform dead inventory into working capital.
Ready to start recovering more value, faster? [Discover Pollen's AI ecosystem can optimize your pricing strategy today.]